
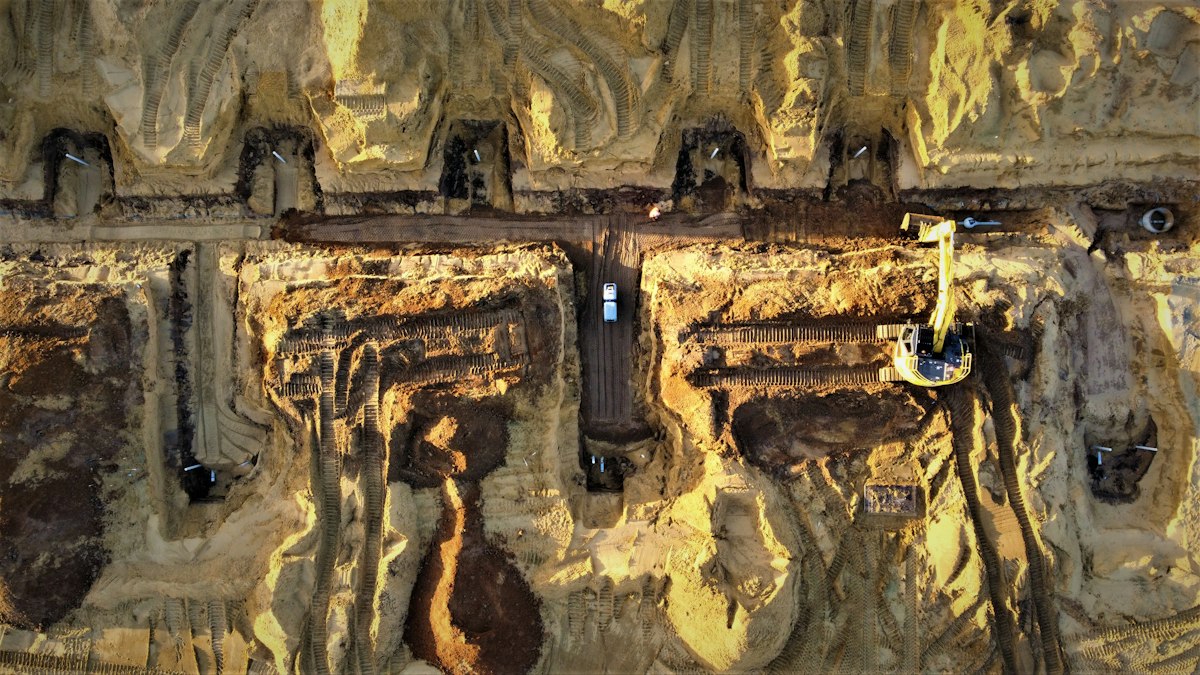
Three underground storage tanks in one city. The two small ones are finished. The big one, which holds most of the water the city was promised, stands at 74 %. Average the three and the city reports 91.33 % complete. Weight each tank by the capacity it provides and the honest figure is 75.70 %.
That gap of nearly sixteen points is the whole case for a development project monitoring system. A spreadsheet averages percentages without complaint, an official reads the result in good faith, and nobody notices until someone stands next to the big tank.
This guide is for the people who specify, buy or inherit these systems: project directors in a PMU or PIU, and the consultants writing their terms of reference. We write from the operator's chair. Since July 2026 NexGenix has migrated, re-engineered and operated the PDP Executive Monitoring Dashboard for the Punjab Development Program, which tracks sewerage, drainage and disposal works in 52 cities. The tank example comes from that system's own method documentation.
Why Spreadsheet and WhatsApp Reporting Breaks at Program Scale
Most programs start the same way. Each site sends a figure, photos land in a WhatsApp group, and someone at headquarters copies it all into a workbook before the weekly meeting. With five sites that works. With fifty cities it breaks, always in the same places:
- Nobody can prove a photo. A forwarded image says nothing trustworthy about where or when it was taken. The same half-built drain can turn up three weeks running.
- Percentages get typed, not measured. "Drain 60 %" is an opinion. Sixty percent of what length, measured by whom, on which day?
- The roll-up averages unequal things. See the tanks.
- History disappears. A workbook shows this week's number, rarely that last week's was higher or who changed it.
- The report is late by design. Two days of consolidation means a briefing about the program as it stood two days ago.
Province-level platforms don't remove the need. Punjab already runs Smart Monitoring of Development Projects, through which departments have filed monthly progress reports since 2016, and a GIS-enabled Monitoring Observatory for Development Projects. Those look across hundreds of schemes. A program's own system works one level down: per structure, per day, with evidence attached.
What a Development Project Monitoring System Must Do
Terms of reference ask for remarkably similar things, whoever funds the work: a web-based and mobile monitoring and information system, MIS with GIS, an Android app feeding a central platform, dashboards, manuals and training. KfW Development Bank has even published a guidebook on remote management, monitoring and verification. The labels matter less than the behavior. These are the ten capabilities we would insist on.
1. Field evidence that is tamper-evident
A photo should become evidence the moment it reaches the server. In the PDP field app, the server burns a banner into the pixels of every photo: program, city, officer, coordinates, Pakistan time and a short verification code derived by hashing the officer, the time and the position. The server stamps with its own clock, so a phone set to last Tuesday can't fake the date.
One caveat: phones don't always get a GPS fix under a slab or in a narrow lane, so record "no coordinates" rather than inventing them.
2. An offline field app that can't file twice
Sites lose signal. An app that needs a live connection trains officers to fill entries in that evening from memory. The PDP Field Progress app queues submissions and photos on the phone and syncs later, and each entry carries its own reference, so a retry never files the same progress twice.
Where you can, measure instead of asking. Sewer progress in the PDP app comes from the line the officer draws over the design alignment using the phone's GPS. Nobody types a percentage.
3. Weighted progress, not averaged percentages
Back to the tanks, step by step:
- Each structure gets a position in its own unit: executed over committed. Tank A holds 1,000,000 gallons and is at 74 %. Tanks B (40,000 gallons) and C (30,000 gallons) are complete.
- The plain average is (74 + 100 + 100) ÷ 3 = 91.33 %.
- Weighted by capacity: 1,000,000 × 74 + 40,000 × 100 + 30,000 × 100 = 81,000,000.
- Divided by the total capacity of 1,070,000 gallons, that gives 75.70 %.
The small tanks are done, but most of the city's new storage sits in the one that isn't. In code it takes a few lines:
// Three underground storage tanks in one city (capacity in gallons, progress in %)
const tanks = [
  { capacity: 1_000_000, progress: 74 },
  { capacity: 40_000, progress: 100 },
  { capacity: 30_000, progress: 100 },
];

const naive = tanks.reduce((sum, t) => sum + t.progress, 0) / tanks.length;

const weighted =
  tanks.reduce((sum, t) => sum + t.capacity * t.progress, 0) /
  tanks.reduce((sum, t) => sum + t.capacity, 0);

console.log(naive.toFixed(2), weighted.toFixed(2)); // "91.33" "75.70"
PDP's full roll-up has four stages. Structures roll up into a component within a city, weighted by what each delivers: gallons for tanks, wet-well volume for disposal stations, running feet for drains and sewers. Components roll up into the city using PMU-set weights that must total 100, and cities into the program by approved cost. Positions are calculated on request, not stored, so the dashboard, the PDF and the data feed never disagree.
One more rule earns its keep: an authorized floor. Once a senior official verifies a position, no later submission can report below it, and only the Secretary or a system administrator can restate it, with the change logged. A genuine correction now needs a signature. That friction belongs there.
If a vendor can't show you the formula behind the headline percentage, the headline percentage is decoration.
4. S-curve progress tracking: planned vs actual
An S-curve plots cumulative progress against time: a slow start, a steep middle, a tapering finish. Put the planned and actual curves on the same axes and the vertical gap is your schedule variance, visible months before a completion date slips.
Illustrative S-curve, not program data. The gap between the planned baseline and the actual line at today's date is the schedule variance.
The actual line needs recorded history. PDP snapshots every position each night, and the S-curve and every "this week" figure read from those snapshots.
The planned line is the harder half. A program with hundreds of packages rarely has a resource-loaded schedule for each one, so PDP's planned baseline is a modeled curve to the target date. That is legitimate as long as the chart says so. A planned line redrawn every quarter to sit just above the actual one is worse than no S-curve.
5. A GIS map organized like the administration
Officials think in administrative units. PDP's map filters from division to district to tehsil to municipal committee and pins every tank, drain and disposal station with its current position.
Maps get heavy fast. One early job on the PDP dashboard cut the map's first-load payload from 37 MB to 9 MB, which on 4G decides whether an official opens it at all. Ask vendors what their map weighs.
6. A live activity wall for the PMU office
PDP Live is a big-screen board showing field filings as they arrive, so a city that hasn't filed by late morning shows up on the wall, not at the monthly review.
It polls the server every ten seconds or so instead of holding a push connection open. Push earns its complexity on a fleet map fed a constant stream of vehicle positions, as our notes on real-time GPS tracking architecture explain. For filings that arrive a few at a time, polling is simpler and nobody watching can tell.
7. One-click reports in the format officials already use
The morning briefing already has a shape and a page order. A system that ignores it gets its numbers retyped into the old template. PDP produces its daily field progress brief as a one-click PDF laid out like the officials' own slides, alongside PDF and Excel reports by city, structure type and safety compliance.
8. Role-based access that scopes data, not menus
PDP has six roles, from field officers who see only their assigned cities to executives who see the whole program. The server filters the data. Hiding a menu item is not access control.
9. An audit trail you could hand to an auditor
On the dashboard, progress entries are append-only and an account with history is disabled, never deleted. PMIS, the contract and payment system for the same program, keeps a four-layer audit trail: decisions, every request, the before and after of every row change, and a nightly SHA-256 hash chain that seals the logs so a later edit breaks the chain.
10. Integration with contracts and payments
Monitoring asks how much has been built. Contract and payment management asks how much is owed, after which deductions, approved by whom. In PDP those are separate systems. PMIS carries each contract's bill of quantities (BOQ) four levels deep, computes nine deduction types on the server, and routes each interim payment certificate (IPC) through an 11-step approval route plus one step after approval. Since 13 October 2026 it has had a live link to the province's Financial Management System, sending approved invoices automatically since 21 October. Draw that boundary in the terms of reference on day one.
Architecture and Data Model Essentials
Dashboards are the visible part. The data model underneath decides whether anyone should believe them. These are the records we would expect, and the rule that makes each one trustworthy:
| Record | What it holds | The rule that matters |
|---|---|---|
| Structure | Each tank, drain, station or sewer reach, with committed scope and unit | Scope changes previewed and re-checked on the server |
| Progress entry | Quantity executed on a date, by an officer | Append-only; corrections are new entries |
| Evidence | Photos linked to the entry | Stamped by the server, never by the phone |
| Weights | Component weights, approved cost per city | Must total 100; changes logged |
| Verified position | The last position a senior official signed off | No submission may go below it |
| Daily snapshot | Every position at the end of each day | Feeds the S-curve and movement figures |
| Audit log | Who did what, when, under which role | Name and role stored on the row |
Keep the stack boring on purpose. The PDP dashboard runs on Node.js 20, Express and MySQL 8.0: about 128,000 lines of code, roughly 210 API endpoints and around 52 tables. Someone will support it for years after the original team moves on, and common technology widens that pool. MySQL is comfortable at this size if the indexing is deliberate, as we found in lessons from optimizing a 287-table production MySQL database. And if the field app is distributed outside an app store, put a minimum-version check on the server.
Taking Over a Live Government System Without Stopping Reporting
Most government monitoring systems are inherited, not greenfield. That was PDP's position in July 2026. The original platform came from Technology Hive; NexGenix took it over, migrated it to the Government of Punjab's own server, and has re-engineered and operated it since. The cut-over on 24 July 2026 cost one day of reduced reporting. This is the order we would follow again:
- Audit before touching anything. Read the code, the schema and what is actually live, and write it down.
- Move a complete copy. Application, database dump and every field photo, which is usually the biggest payload: 13,595 files at handover in PDP's case.
- Allow one writer at a time. Fix the exact moment the old server stops accepting field data and the new one starts.
- Keep the field app working. Ship an update that knows the new address before cut-over, then force old versions to update.
- Verify by counting. Records, photos and per-city totals, before and after.
- Then improve in small releases, each with a backup first and a way back, the discipline behind our four-phase custom software development process.
Procurement Checklist: What to Ask a Monitoring System Vendor
Run these in the demo, on your own data, with the real users in the room.
- "Show me the formula behind the headline percentage." Expect weights, units and a worked example on one of your cities.
- "Switch to airplane mode, submit progress, then reconnect." It should queue, sync once and arrive stamped by the server.
- "What stops someone filing last month's photo as today's?" A server-side stamp, not the phone's metadata.
- "Log in as a field officer." Only assigned sites, enforced by the server.
- "Lower a structure's progress." Refused below the verified position, or logged with who and why.
- "Where does the S-curve's planned line come from?" An approved schedule, or a labeled model.
- "Produce last week's briefing in our format." If it needs a developer, it won't happen on a Monday.
- "Can it run on our own server?" Ask what it needs from the network.
- "What do we get at handover?" Source code, schema documentation, a user manual, deployment steps and training, written into the contract.
- "How do you release changes to a live system?" Backups, a rollback path and a change log.
Red Flags in a Development Project Monitoring System
- Progress entered as a typed percentage with no quantity behind it.
- Photos accepted from the phone's gallery, with no stamp applied by the server.
- A headline number nobody at the vendor can derive by hand.
- A delete button on submitted progress.
- A demo that only runs on sample data.
- No clear answer on who owns the source code and the data.
The one we would walk away over is the delete button. Once history can be overwritten, every figure in the system becomes negotiable.
PDP Punjab: Monitoring 52 Cities
The Punjab Development Program (PDP) is building sewerage, storm-water drainage and disposal infrastructure in 52 cities across 25 districts of Punjab, home to about 7 million people. As of November 2026 it spans 394 contract packages with an approved program cost of about PKR 308 billion. Its Program Management Unit (PMU), set up by the Local Government & Community Development (LG&CD) Department, Government of Punjab, works with two systems:
- The PDP Executive Monitoring Dashboard (web plus an Android field app) covers physical progress, evidence, maps and reports. As of November 2026 it holds about 33,000 field photos (most of them geotagged) and has six roles and eleven modules across 27 web pages; the field app is at version 2.9.0.
- PMIS, the Project/Contract & Payment Management System, handles BOQs, interim payment certificates, deductions and the Financial Management System link. It has 70+ tables and 45+ live releases, and its approval routes have been configurable on screen since 24 October 2026.
The original platform for both came from Technology Hive. Both were migrated to the Government of Punjab's own server and have been re-engineered and operated by NexGenix since July 2026.
The lesson we would pass on is about adoption. A system that produces the documents officials already use, like the morning brief in their own slide layout, needs little training to be taken up. Build those early. The dashboards can follow.
The PDP Executive Monitoring Dashboard case study has the screens and the timeline. The companion PMIS contract and IPC payment system case study covers the approval route and the finance link. Scoping something similar? Our government software development page explains how we work with PMUs.
Frequently Asked Questions
What is a development project monitoring system?
Software that records the physical progress of development works from the field, with photo evidence, and rolls it up into dashboards, maps and reports. A good one weights progress by what each structure delivers and keeps the history of every figure.
What is the difference between monitoring and evaluation in an M&E system?
Monitoring tracks progress continuously while work is under way: quantities built, money spent, schedule variance. Evaluation looks back at set points to judge whether the program achieved its intended results, using the data monitoring collected.
How do geotagged photos verify progress on government projects?
Each photo from the field app is tied to a structure and a progress entry, and the server stamps it with the officer, coordinates and time, so reviewers can confirm it came from the right site on the right day.
What is an S-curve in project monitoring?
A chart of cumulative progress over time for the planned baseline and the actual work. The gap between the two lines shows how far ahead or behind schedule the project is.
Can a project monitoring system run on a government's own server?
Yes, and for most government bodies it should. The PDP systems run on the Government of Punjab's own server. Plan for restricted internet access and backups the department controls.
How is a monitoring system different from a contract and payment management system?
A monitoring system measures how much has been built. A contract and payment management system, often called a PMIS, handles the BOQ, interim payment certificates, deductions and approvals before money moves. Large programs need both.
Start With the Evidence, Not the Dashboard
Every development project monitoring system is judged in the end by one question: when an official quotes a figure in a meeting, can anyone prove it? Specify the evidence chain, the weighting method and the audit trail first. The charts are the easy part.
Scoping a monitoring system for your program?
Tell us how many sites you have, who reports from them and what your officials need on their desk each morning. We will tell you plainly what to build, what to buy and what to write into the terms of reference.
Reviewed by the NexGenix engineering team. Read our editorial guidelines to learn how we verify sources, disclose AI assistance, and correct errors.


Discussion
Sign in to join the discussion